
adx-trend strength indicator: How To Use it
The ADX, short for average movement directional index, is an indicator that's used to determine when the price of an asset is trending strongly.

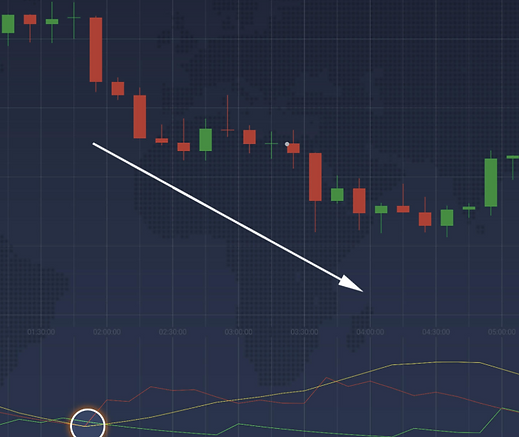
As you can see, there are 3 lines; a yellow one, red, and green one. The yellow one is the ADX itself, whilst the green one is known as the +DI (directional index), whilst the red one is the -DI. These three are used to determine the direction & strength of the trend. Traders use the ADX to identify strong trends, as well as when to enter a trade, or when to exit (great for forex trading).
Developed by a gentleman by the name of Welles Wilder, the ADX is your go-to indicator if you want to quantify the trend strength.

Looking at the image above, we can see the -DI (red line) above the +DI (green line) at the beginning. This indicates a bearish (downward) trend. Conversely, when the +DI is above the -DI, this is indicative of a bullish (upward) trend. The ADX (yellow) only shows the trend strength, and not the direction. That's the job of the green and red lines.
Before we continue, have you downloaded the platform yet ?


RISK WARNING: YOUR CAPITAL MIGHT BE AT RISK
How do i set up adx indicator ?
Setting up the ADX indicator is very simple. If you're on a mobile phone, when you open IQ Option, you will see a symbol at the bottom-left that looks like an antenna (as illustrated in the image below). Choose ADX (circled) from the list.

If you're on a PC, you click on the last icon at the bottom-left. Once you do that, you will be presented with the list of all the technical indicators. Select ADX, found near the bottom.

You may select to alter the default parameters, but just keep in mind that increasing the period will reduce the sensitivity of the ADX, but also increase its accuracy.
How do i use it for trading ?
There are two ways one can use the ADX indicator. The first is by looking at the red and green lines (-DI & +DI). When they cross, this normally signifies a trend reversal. This can be useful in determining optimal entry points for a trade.

When you see this, and the general trend is bullish (upward), you execute a CALL option.
Conversely, when the -DI is above the +DI, and the general trend is bearish (downward), this means you execute a PUT option.
What do you notice about the ADX line (yellow) when the trend is moving ? That's right ! It moves up. Remember we said that the ADX measures the trend strength, so by looking at it you can determine whether to enter a trade, or opt out.
The ADX ranges from 0-100, with 0 indicating a flat market, and 100 signifying a very powerful trend!
You as a trader can use the ADX as a way of confirming whether the trend will continue in a bullish or bearish pattern. A good way to do this is to pair it with another indicator, and the perfect one for this task is known as the Alligator. This indicator is great at determining whether the trend is going upwards and downwards.
So, without further ado, let's learn about the Alligator.
If you like what you have learnt today, please leave a Like on FB. Thanks.


RISK WARNING: YOUR CAPITAL MIGHT BE AT RISK